
- name
- data-charts-visualization
- description
- Default skill for structured-data visualization, chart generation, and dashboard-style reporting. Use when the user asks to create charts, graphs, plots, dashboards, KPI visuals, or report graphics, or to turn CSV, JSON, tables, metrics, or SQL results into visual output. Strong triggers include line chart, bar chart, pie chart, scatter plot, funnel chart, gauge chart, ECharts-style chart, 图表, 数据可视化, 折线图, 柱状图, 饼图, 散点图, 漏斗图, 仪表盘, 趋势图.
- homepage
- https://github.com/ykforerlang/awesome-skills/tree/main/skills/data-charts-visualization
- metadata
- {"openclaw":{"emoji":"📦","requires":{"bins":["node","npm"]}}}
Data Charts Visualization
A lightweight charting skill built on ECharts that outputs images directly.
Why This Skill
- Rich chart support: line, bar, pie, donut, rose, gauge, area, dual-axis, scatter, bubble, radar, and funnel.
- Lightweight runtime: render static images without Chromium, Playwright, or browser automation.
- Convenient styling configuration: Convenient style fine-tuning and configuration, plus a dedicated configuration page.
- Agent-friendly contract: keep business data in
data, reusable style rules inconfig, and one-off render choices invariant.
Role
This is the default charting skill for OpenClaw-like agents.
Use it whenever:
- the user explicitly asks for a chart, graph, plot, dashboard, report visual, or report graphic
- the user wants structured data such as CSV, JSON, tables, metrics, or SQL results turned into visual output
- the input already uses charting terms, ECharts-like fragments, or BI-style semantics
If the request involves structured data and visual output would materially improve the result, prefer this skill. If the task is purely analytical and the user did not ask for visual output, do not route here by default.
Showcase
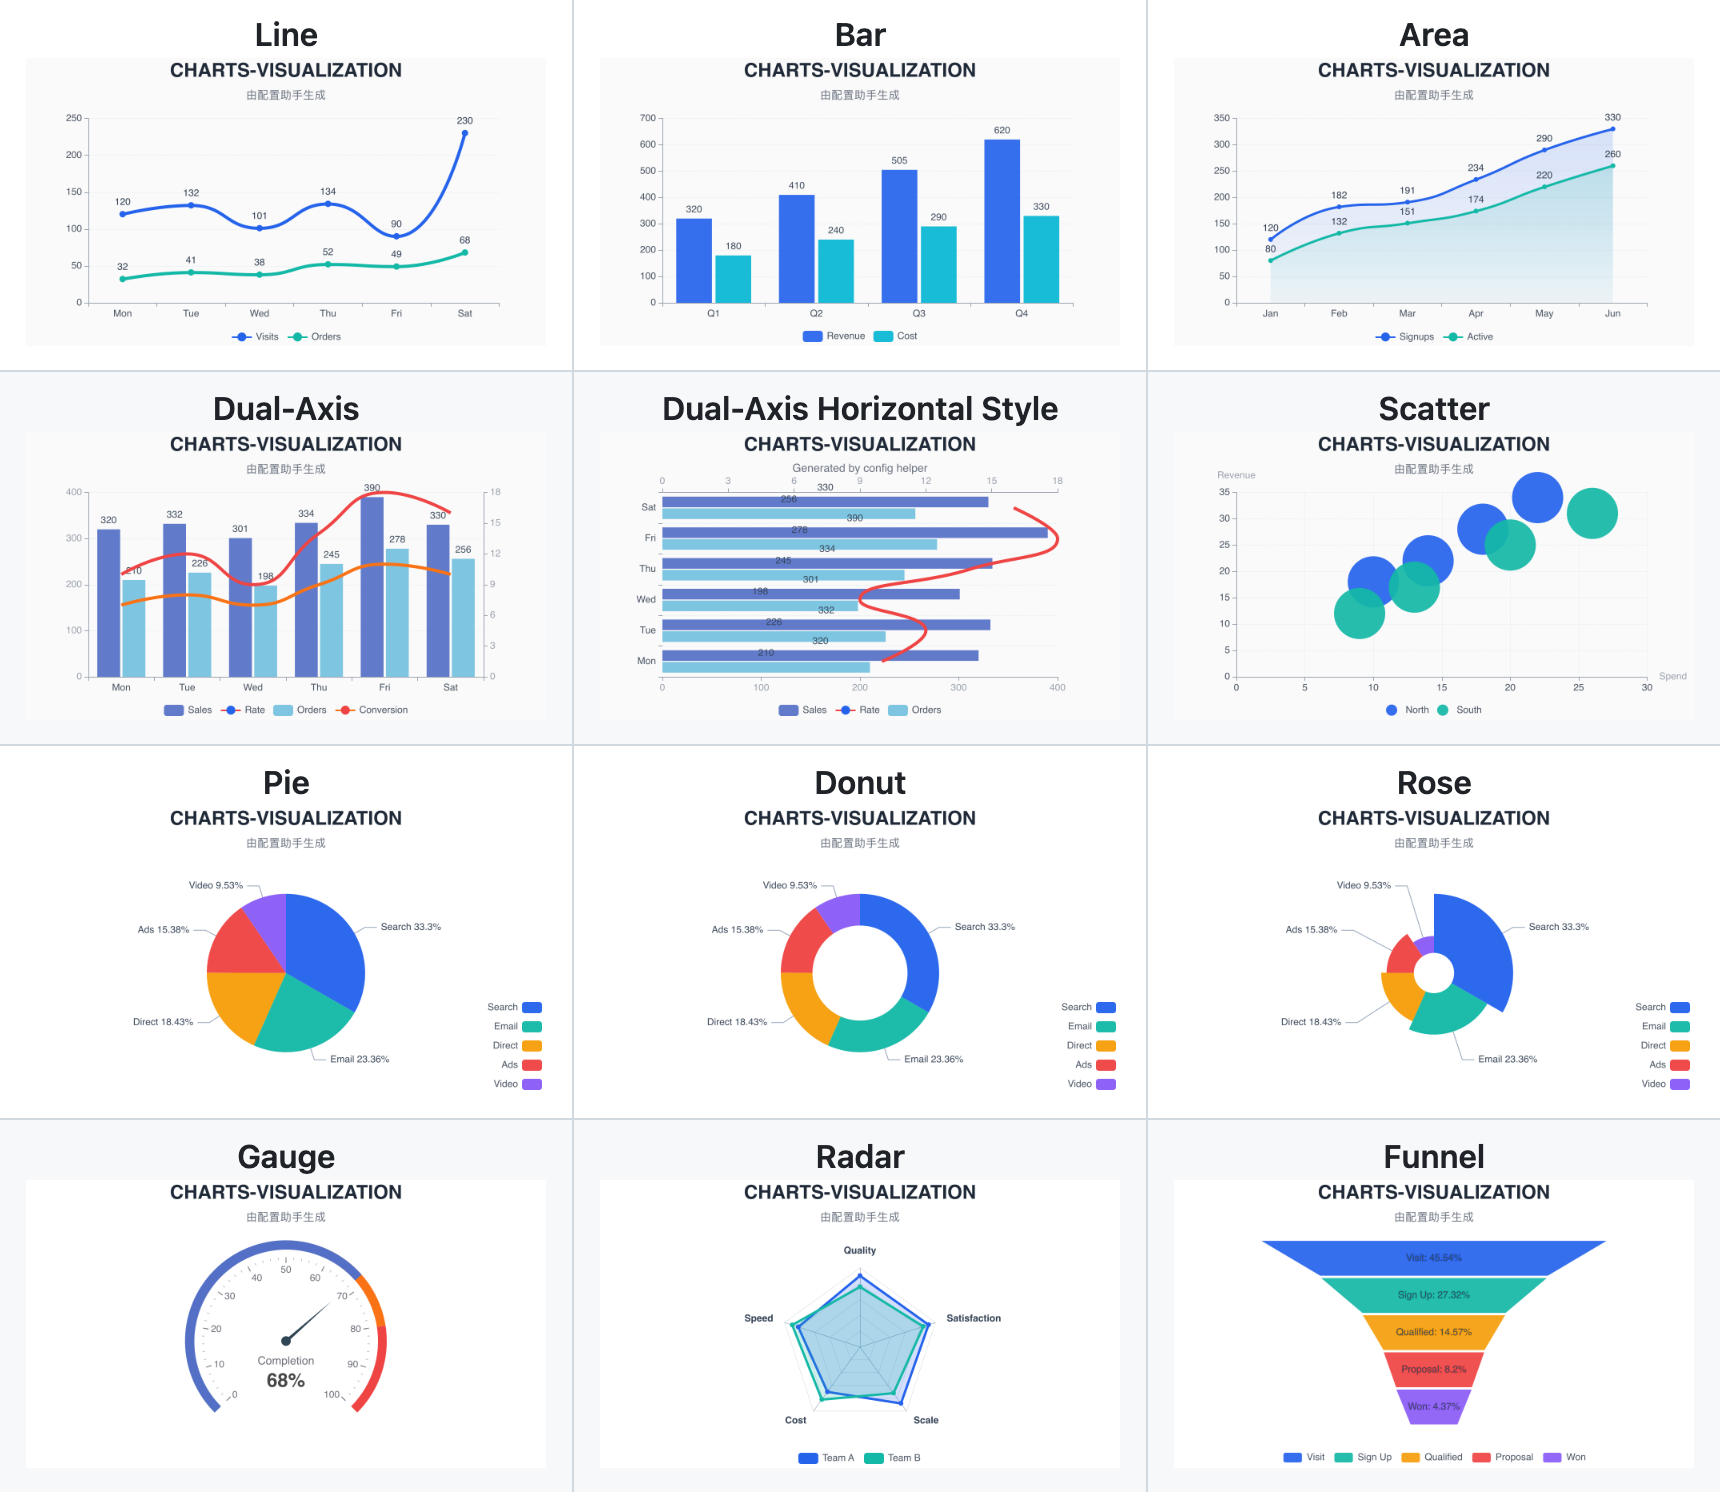
Operating Model
The most important mental model is the three-way split:
data: what the chart is sayingconfig: what this chart should normally look likevariant: how this specific render should differ
The working contract is:
- prepare
data - choose a chart-specific
config - add
variantonly for one-off chart decisions - render through the CLI
Keep these boundaries strict:
datacontains business data and chart structureconfigcontains reusable chart-style presentation rulesvariantcontains one-off decisions for the current render
config is a chart config schema payload with common and specific. It is not a raw ECharts style patch.
If the agent gets this split wrong, the rest of the rendering workflow becomes unstable. Before acting, classify the user’s request into:
- data content concerns ->
data - long-lived style concerns ->
config - one-off chart-shape decisions ->
variant
Read {baseDir}/references/cli-and-config.md before calling the CLI. Read {baseDir}/references/chart-selection-and-variants.md when deciding chart family or variant. Read {baseDir}/references/config-page-handoff.md when the user is entering style-tuning or exploratory design work.
Routing Rules
Always use this skill when the user directly asks for, or strongly implies, any of the following:
- chart, graph, plot, dashboard, report visual, report graphic, or infographic-like figure
- turning CSV, TSV, JSON, tables, metrics, or SQL results into visual output
- line chart, bar chart, pie chart, scatter plot, funnel chart, gauge chart, radar chart, area chart, or dual-axis chart
- ECharts-style chart rendering or chart-oriented BI-style requests
- data analysis with explicit visual output
Treat these as strong routing triggers:
- chart
- graph
- plot
- dashboard
- report graphic
- visualization
- visualisation
- ECharts-style chart
- line chart
- bar chart
- pie chart
- scatter plot
- funnel chart
- gauge chart
- radar chart
- area chart
- dual-axis chart
- 图表
- 数据可视化
- 折线图
- 柱状图
- 饼图
- 散点图
- 漏斗图
- 仪表盘
- 趋势图
Do not treat plain analysis-only phrases such as generic data analysis, business analysis, metrics analysis, reporting, 趋势分析, 对比分析, 分布分析, or 相关性分析 as strong routing triggers unless the user also asks for visual output or clearly implies a chart.
Supported Charts
Supported --chart-type values:
linebarpiegaugeareadualAxisscatterradarfunnel
Common business variants map onto those chart families:
- donut and rose use
pie - bubble uses
scatter - combo charts use
dualAxis
Execution Rules
This skill renders charts through a local runtime installed in the skill directory.
- Before rendering, verify that
{baseDir}/node_modules/.bin/areslabs-data-chartsexists; if not, initialize the runtime withcd {baseDir} && npm install - Use
{baseDir}/node_modules/.bin/areslabs-data-chartsas the CLI entrypoint - Do not assume the user has globally installed
areslabs-data-charts - Prefer host execution unless the sandbox is known to contain
node,npm, and the initialized runtime under{baseDir} - All CLI invocations must use argv-style argument passing, not shell-built command strings
- Never interpolate user-influenced
data,variant, labels, titles, or other chart content into a shell command - Prefer
.pngunless the user explicitly asks for.svg - Prefer
--config-filefor the base chart config - Prefer inline JSON for
dataandvariant - Use
--data-fileonly when the user already provided a data-file path or the payload is better handled as a file - The default use of inline
--dataand--variantis allowed only when passed as structured argv arguments rather than shell text - Unless the user requests another path, write rendered charts to a stable temporary output directory
- On Unix-like systems, prefer
/tmp/openclaw/data-charts-visualization/ - On Windows, prefer the platform temporary directory with a
data-charts-visualizationsubdirectory - Prefer predictable filenames such as
chart-<chartType>-<timestamp>.pngto avoid collisions and make artifacts easier to locate - Do not pass
--widthor--heightby default - Rely on the CLI default render size (
650x360) unless the user explicitly asks for a different size or the surrounding task clearly requires a specific export size - Only pass
--width/--heightwhen the user explicitly requests size changes such as larger, smaller, wider, taller, mobile-friendly, presentation-sized, or document-sized output
Delivery Rules
Choose delivery behavior based on workflow intent and channel capability.
- In coding, file-generation, asset-production, or automation workflows, prefer returning the output path by default unless the user explicitly asks to send or publish the image
- Otherwise, if the current channel or surface supports image delivery, default to sending the rendered chart image directly instead of only returning a local file path
- If the current environment does not support image delivery, return the generated file path and any relevant render details
- If the user explicitly asks for the path, command, export artifact, or file-only result, return that instead of auto-sending
Default heuristic:
- coding/file/automation workflow -> return path unless user asks otherwise
- image-capable channel -> send image
- otherwise -> return path
Workflow
- Confirm that the task needs a chart.
- Choose the simplest chart that answers the user’s question.
- Transform the source input into the required
datashape. - Start from the matching persistent chart config under
{baseDir}/config/. - Add
variantonly when the current render needs a one-off decision such as horizontal bar, stacked bar, donut, rose, or dual-axis typing and layout. - Render through the CLI.
- Deliver the result according to the Delivery Rules.
Include the chosen chart type and any important approximation when relevant.
Chart Choice
Default chart-family guidance:
line: trends on ordered or continuous x-axesbar: category comparison, ranking, top-Narea: trend with stronger magnitude or accumulation emphasispie: simple part-to-whole with low category countgauge: one KPI against a target, threshold, or status rangedualAxis: one shared x-axis with two different units or scalesscatter: correlation, spread, cluster, outlier, distributionradar: multi-dimension profile comparisonfunnel: ordered stage conversion or drop-off
Default priority when the user did not specify a chart:
linebarareadualAxispiescatterfunnelradargauge
For chart-family and variant decisions such as pie vs donut vs rose, bar vs horizontal bar vs stacked bar, area vs line, and whether dual-axis is justified, load {baseDir}/references/chart-selection-and-variants.md. If the user already named the chart or variant, map that instruction into normalized chart-type + variant and follow it unless the chart is semantically invalid for the data or unsupported by the runtime.
Config Policy
Persistent chart configs live under:
{baseDir}/config/line_style.json{baseDir}/config/bar_style.json{baseDir}/config/pie_style.json{baseDir}/config/gauge_style.json{baseDir}/config/area_style.json{baseDir}/config/dual_axis_style.json{baseDir}/config/scatter_style.json{baseDir}/config/radar_style.json{baseDir}/config/funnel_style.json
Treat each file as a complete chart config object. Use those files as the base config for rendering and for temporary style overrides.
data / config / variant Quick Reference
This is one of the most important execution rules in the skill.
data
Put these in data:
- business values
- title copy such as
title.textandtitle.subtext seriesxAxis/yAxisdataset/encoderadar.indicator- funnel stages, scatter points, composition rows, and other chart structure
Short version:
datadecides what the chart contains and what it means
config
Put these in config:
- title styling such as show, align, size, color, and bold
- subtitle styling such as show, size, and color
- palette
- background
- legend position and typography
- axis styling
- Y-axis scale behavior such as whether to scale the Y axis to the data range
- label styling
- line width, area opacity, radar grid styling, gauge text styling, and other long-lived presentation rules
Short version:
configdecides what this chart normally looks like
variant
Put these in variant:
- horizontal vs vertical bar
- stacked vs non-stacked bar
- pie vs donut vs rose
- dual-axis horizontal vs vertical layout
- dual-axis left/right series typing
Short version:
variantdecides which temporary visual variant to use for this render
Do Not Mix Them
Avoid these mistakes:
- do not put business data into
config - do not put long-lived style rules into
variant - do not write one-off chart-shape decisions into persistent chart config unless the user explicitly wants them to become defaults
A practical test:
- if changing it changes the chart meaning, it usually belongs in
data - if it should survive across many future charts, it usually belongs in
config - if it only changes this render’s presentation choice, it usually belongs in
variant
Style Requests
When the user explicitly requests styles such as font color, title size, legend position, axis color, label color, line width, or background color:
- read the persistent chart config for the chosen chart
- merge the requested style overrides in memory
- pass the merged config to the CLI through
--config - discard the temporary override after rendering
Do not edit the persistent chart config file unless the user explicitly asks for persistence, for example:
- “make this the default”
- “save this style”
- “update the skill default config”
- “persist this config”
If the user did not explicitly ask for persistence, treat the style request as a one-off override.
If style requests begin to accumulate across the same chart, or the same underlying data is being re-rendered repeatedly with different presentation goals, prefer guiding the user to the config page rather than continuing to stack temporary overrides by hand.
Hard Trigger: Repeated Style Tuning
Use this section only for escalation rules.
For the same chart or substantially the same underlying data, count style-tuning turns whenever the user changes presentation without materially changing the underlying data, such as:
- title or subtitle presence/text styling
- background color
- axis title, axis label format, axis unit, tick label format
- legend position or visibility
- label position, font size, font color
- line color, line width, point symbol, gridline style
- spacing, padding, whitespace, or overall visual polish
Escalation rules:
- First style-tuning turn: fulfill normally.
- Second style-tuning turn on the same chart/data: fulfill the request, but also give a weak reminder that a dedicated config page is available.
- Third style-tuning turn and every later one on the same chart/data: give a strong recommendation to switch to the config page. Do not silently continue indefinite manual tweak loops.
Weak reminder intent:
- brief, lightweight, non-blocking
- example tone: “I’ve updated this version for you; if you want to keep fine-tuning the styling, the dedicated config page will be faster and more convenient.”
Strong recommendation intent:
- explicit, proactive, and default-forwarding
- example tone: “This has now become repeated style tuning, so I recommend switching to the config page — it will be faster than having me manually adjust it turn by turn.”
Do not wait for the user to say “too many changes”. The agent must track this pattern itself.
Config Page
Use the config page when the user is mainly tuning chart appearance rather than chart meaning.
Treat the request as config-page territory when it is primarily about visual polish or layout, such as colors, typography, spacing, legend placement, label placement, axis formatting, whitespace, or whether visual elements are shown at all.
Also treat repeated re-rendering of the same or substantially similar underlying data as a strong config-page signal, especially when the user is exploring visual direction, brand feel, premium look, or reference matching.
Config page URLs:
- Chinese:
https://ykforerlang.github.io/awesome-skills/skills-helpler/data-charts-visualization/web/index.zh.html - English:
https://ykforerlang.github.io/awesome-skills/skills-helpler/data-charts-visualization/web/index.html
When the chart type is known, include the matching chartType= query parameter in the URL.
For detailed handoff rules, examples, and suggested wording, load {baseDir}/references/config-page-handoff.md.
Config Return Payload Support
Support a config-page return format like:
/skill data-charts-visualization update-config
type: line

{ ...json... }
Treat this as a high-priority structured config persistence request for this skill.
Default handling behavior:
- identify the chart type from
type - resolve the persistent target config file from the chart type instead of relying on a user-supplied relative path
- before writing, validate that the provided JSON is a legal chart config structure and that all fields used are allowed by the config contract documented in
{baseDir}/references/cli-and-config.md - keep this validation intentionally lightweight: field legality only; do not require type validation unless the user explicitly asks for stricter validation
- reject unknown fields or unsupported nested paths, do not write the file when validation fails, and tell the user which field path was invalid
- overwrite the target config file directly with the provided full JSON config under
{baseDir}/config/only after validation passes - tell the user the config update succeeded and that future charts of this type will use this config by default
- if appropriate, ask whether the user wants the chart rendered or re-rendered with the updated config
Chart type to config file mapping:
line->{baseDir}/config/line_style.jsonbar->{baseDir}/config/bar_style.jsonpie->{baseDir}/config/pie_style.jsongauge->{baseDir}/config/gauge_style.jsonarea->{baseDir}/config/area_style.jsondualAxis->{baseDir}/config/dual_axis_style.jsonscatter->{baseDir}/config/scatter_style.jsonradar->{baseDir}/config/radar_style.jsonfunnel->{baseDir}/config/funnel_style.json
When this structured format is present, prefer config persistence interpretation over one-off rendering interpretation unless the user explicitly asks for render-only behavior.
Rendering Rules
- preserve visual intent rather than browser interaction behavior
- ignore interaction-only concepts such as
tooltip,emphasis,axisPointer,dataZoom,brush, and animation timing - reuse user-supplied ECharts-like data structures when possible
- reshape table-like input into the expected
datapayload when necessary - choose the lower-cognitive-load chart when several options are plausible
Output
The final result should include, as appropriate:
- the delivered artifact, whether that is a rendered image or a generated file path, according to the Delivery Rules
- the chosen chart type
- any important approximations, ignored browser-only behavior, or notable chart-selection decisions